- Contents
 Once quantitative data has been gathered and cleaned, the next step in the research process is to analyze the data in order to glean insights from it. This step is crucial as data must be analyzed properly before a researcher can understand which findings are significant and report on the findings or make a judgment on their hypothesis. If data is not analyzed with care, findings may be misrepresented, which can lead to decisions being made upon statistics that did not accurately represent the entire dataset.
For example, one might use an average to represent a fact such as the amount customers are willing to pay for ice cream. However, if 95% of respondents stated that they would spend $5 or less on a pint of ice cream, and 1% of respondents stated that they would spend $100 on ice cream, an average would be skewed by the 1% who would spend much more. In this case, a researcher may decide that a different statistic, such as the median, would more accurately represent the findings. Making these judgments is an important step in the quantitative data analysis process, as are ensuring that data is properly cleaned and coded prior to analysis.
Quantitative Analysis Methods
Quantitative data is analyzed using statistical methods, as quantitative data represents numbers from which datapoints can be calculated. Data from a quantitative dataset, such as survey results, is usually loaded into a program such as Excel or the statistics software SPSS which enables researchers to quickly create tables and charts in order to examine findings. Often the first step in analyzing a dataset is to view top-level findings using descriptive statistics such as mean, median, and mode.
Descriptive Statistics
In the below definitions, we will use the example of a survey with 400 respondents who were asked to rate their opinion of chocolate ice cream on a scale of 1 ‘strongly dislike’ to 5 ‘strongly like’. The data indicated that 100 rated an ice cream flavor a ‘5’, 200 rated it a ‘4’, and 100 rated it a ‘3’.
- Mean or average: The numerical average of a set of numbers.
- In the above example, the average rating would be ((5×100)+(4×200)+(3×100))/400= 4
- Median: The median is the midpoint in a set of numbers.
- In the above example, the median would be the number in the 200th row of data. In this case it would be 4, but depending on the dataset, the median can be different from the average.
- Mode: The number that occurs the most often in a dataset.
- In the above example, this would also be 4 as it occurred 200 times, while 5 and 3 only occur 100 times each.
- Range: A statement that represents the lowest and highest numbers in a dataset.
- In the above example, the range would be from 3 to 5.
- Distribution or Percentage: The percent represented by each category within a group, out of the total (100%).
- In the above example, instead of looking at the dataset as a whole this would report that ‘25% rated the ice cream a ‘5’, 50% rated it a ‘4’, and 25% rated it a ‘3’
Cross Tabulations
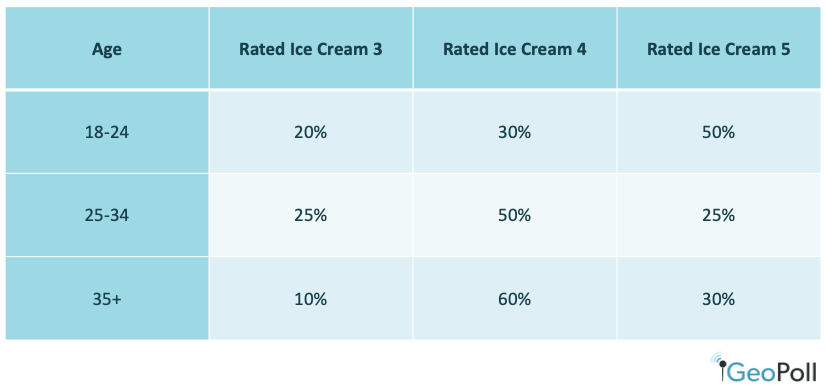
After examining descriptive statistics, researchers may use cross-tabulations to dig deeper into a dataset. A cross tabulation or crosstab is a way to show the relationship between two variables and is often used to compare results by demographic groups. For the above example, we could create crosstabs to show results by age:
Crosstabs can also be created to examine one datapoint by another, such as if those who rate chocolate ice cream highly also rate vanilla ice cream highly, or if there is a different relationship between the two variables. Crosstabs are useful to better understand the nuances of a dataset and the factors that may influence a datapoint.
Calculating Statistical Significance
When researchers are looking to prove or disprove hypotheses, they will often also use measures to calculate the statistical significance of their findings. Measures of statistical significance demonstrate if a finding is merely due to chance or if it is a significant finding that should be reported on. In the above example, without calculating statistical significance we cannot be sure if the difference in results between those aged 18-24 and 25-34 is due to the difference in age groups, or if the findings are a coincidence based on the sample that was selected and not related to age.
Statistical significance is usually represented by a statistic called a p-value. A p-value is a calculated number between 0 and 1, and the lower the p-value is, the less likely it is that the results were due only to chance. Typically, a p-value of less than 0.05 is regarded as statically significant, as it means there is a less than 5% likelihood that the results were due to chance. While having a p-value of under 0.05 doesn’t necessarily mean that the stated hypothesis is true, it decreases the chances that any differences in the dataset are occurring by chance. Researchers who are running tests to make decisions, for example to determine if populations prefer vanilla or chocolate ice cream in order to make purchasing decisions, should use a test of significance in order to have more confidence in their decision making.
Programs including Excel, R and SPSS can calculate the significance of findings through a series of steps, outlined in more detail here. If you work with a full-service research agency such as GeoPoll, we can run statistical significance tests for you and include the resulting data in our data analysis.
Conduct Quantitative Data Analysis with GeoPoll
GeoPoll is a research company that gathers data for international organizations, governments, consumer brands, and media houses which enables better decision making. Our services range from study and questionnaire design to data analysis, including the creation of data tables, crosstabs, and full research reports. To learn more about our capabilities or get a quote for your next project, please contact us.