- Contents
Kenya goes into the General Election 2022 on August 9th. To gather insights into some of the aspects surrounding the election, GeoPoll ran an internally sponsored opinion poll covering a number of topics, which we are pleased to release in this report.
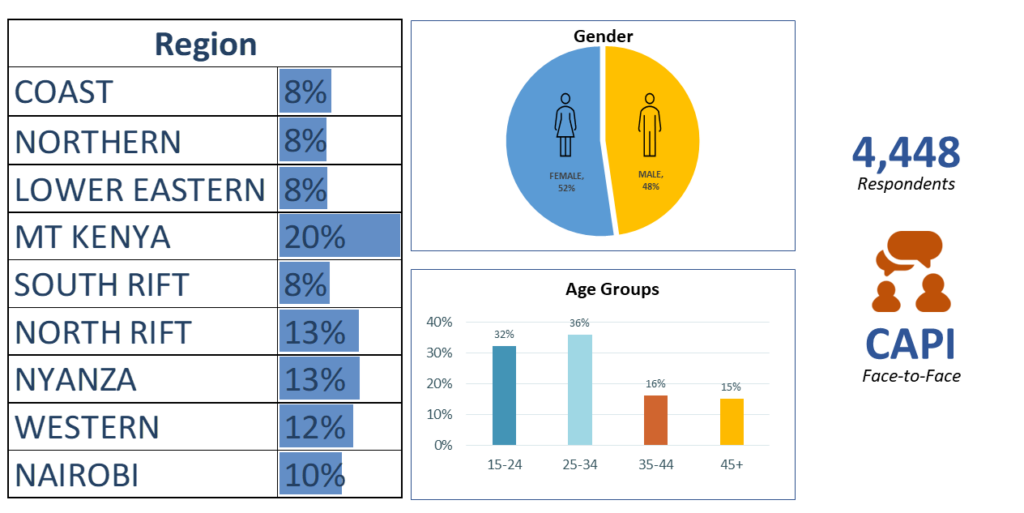
GeoPoll, a leading market and social research company, conducted the survey in person utilizing our Computer-Assisted Personal Interviewing (CAPI) platform. The technology enabled trained enumerators to collect data face-to-face from a nationwide sample in just two weeks (July 19 – August 2), ensuring up-to-the-minute election feedback.
92%: The Intent to Vote is Quite High – will there be a higher voter turnout than in 2017?
The voter turnout for the 2017 Kenya General Elections was 79.51%. This year, according to our survey, 92% of registered voters answered yes to the question “Do you intend/plan to participate in the upcoming elections on August 9th, 2022?” Five percent said they do not plan to vote, while 3% were yet to make up their minds.

A growing voters base: 29% will be voting for the first time in this election.
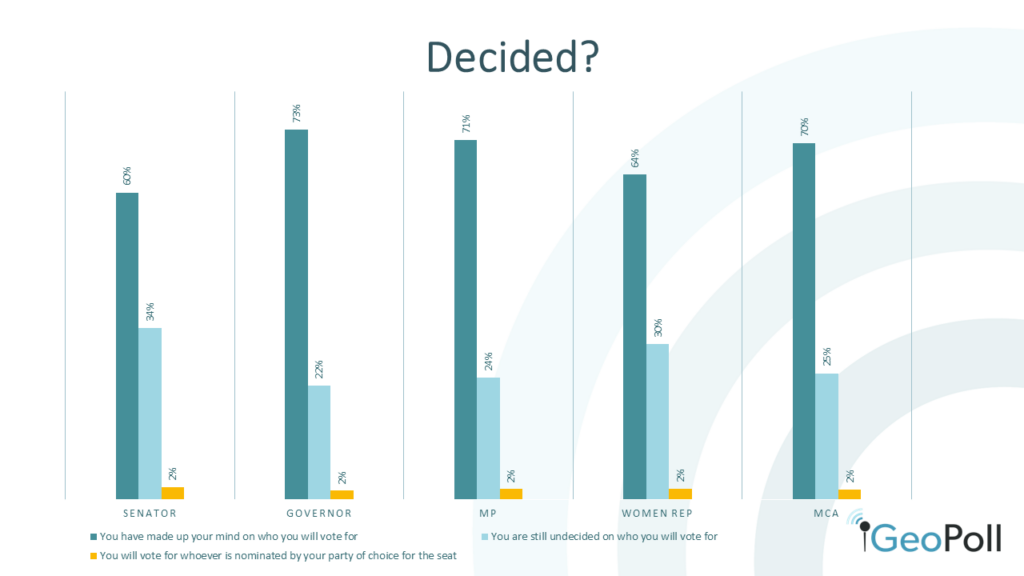
Battleground: A good number of voters are still undecided
With a week to the elections, only 67% on average are decided on who to vote for (for all seats except the presidential election). More than 1 in 4 (27%) are still undecided and 2% plan to go with the 6 piece – voting for their party candidates.
Information Sources and Fake News
When the respondents were asked if they feel able to access all the true/accurate information they need about the 2022 General Election, 56% replied in the affirmative. A significant 26% responded “no” and 13% claimed to be unsure.
Most respondents (60%) have encountered information about the election that they suspect to be deliberately false or inaccurate. While 19% say they have encountered “some” false information or fake news, 6% say “all” the information they encountered has been false. Forty percent do not believe any of the election information they encountered has been false.

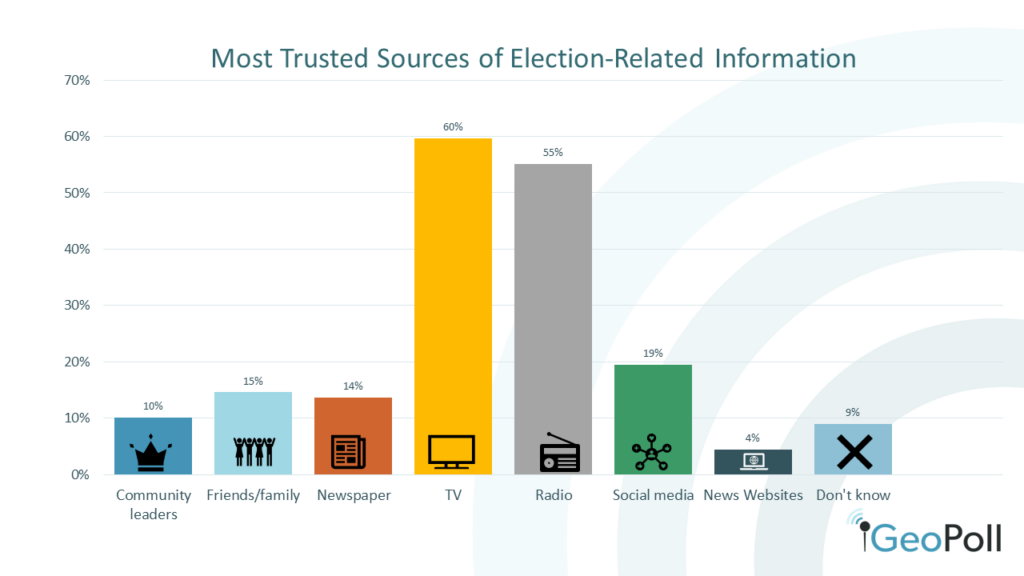
TV and Radio are the most trusted source of election-related Information
The media plays a critical role in any democratic and governance process, and it is imperative that news and information around elections be credible to guide the decisions of the voters. But trust is relative and can be tied to the perceptions the people have of the media channels.
In this survey, most people said they trusted TV (60%) and radio (55%) to provide the most credible information. In an environment where blogs are considered too informal and unregulated, news websites were the least trusted.
Sampling & Methodology
This survey was conducted in person by trained enumerators between July 19 and August 2, 2022 using GeoPoll’s Computer-Assisted Personal Interviewing (CAPI) mode. It is a nationally representative survey meaning that GeoPoll proportionately covered the entire country to the county and sub-county levels, deriving the sample from population data from the 2019 Kenya National Bureau of Statistics Census.
The number of respondents was 4,488 (a 1.47% margin of error) with 52% females and 48% males. The age groups were distributed as follows: 15-24: 32%, 25-34: 36%, 35-44: 16% and 45+: 15%. 64% of the respondents live in rural areas while 34% live in urban areas and the rest live in peri-urban settings. The sample included respondents covering all education levels, ranging from respondents without formal education to holders of post-graduate qualifications.
If you have questions or would like more information about this survey, the methodology used and the sampling frame, please contact us via info-at-geopoll.com.