- Contents
Authored in conjunction with Jessica Gergen and Mary Kate Chandler of Visualst
GeoPoll and Cyclone Idai
In March of 2019, Cyclone Idai caused devastating destruction in Mozambique, Malawi, and Zimbabwe. In order to support the humanitarian response, GeoPoll deployed a remote, SMS-based survey to the regions hardest hit in Mozambique to gather on-the-ground data on infrastructure damages, food security, and the aid needed most by communities. The data from this initial research was released for free on our blog, which was then picked up by the Humanitarian Data Exchange, or “HDX.”
Shortly after, an organization called Visualst, a public-interest data firm based in Maputo, Mozambique, came across GeoPoll’s data on the humanitarian need following the storm. This data was then used during a workshop hosted by the organization called Cyclone Idai Data Stories, which is a 3-part workshop series that is still in progress.
Cyclone Idai Data Stories by Visualst: A GeoPoll Facilitated Data Workshop
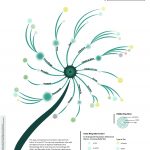
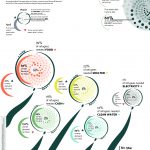
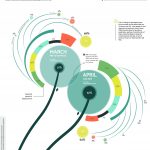
In the first workshop, Visualst used data from the GeoPoll facilitated study, to spur thoughtful and reflective dialogue about how to better respond to natural disasters and climate refugees in poor countries. The self-initiated Visualst workshop series uses data visualization to explore the supply and demand of the relief efforts to Cyclone Idai in Mozambique.
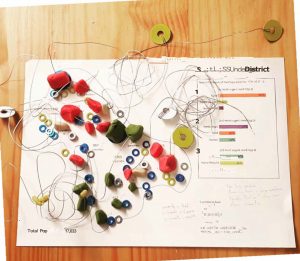
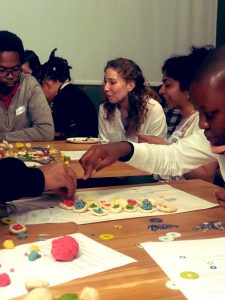
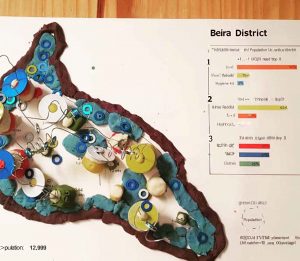
Visualst just hosted its first workshop of the series. During this first session, small groups were assigned a district and provided a map with community population numbers, ‘expected displacement time’, and the top three most urgent needs. Participants were tasked to build a ‘needs’ map, represented with clay. Each group was then to allocate resources, represented with small metal hardware pieces called washers, and simulate, through the use of crafting wire, the ‘supply chain’ of resource distribution across the whole district. The available resources that participants could allocate included resettlement camps, food, home rebuild, and seeds/agricultural aid.
Each group took a unique approach to shape the clay and warp the wire to create their group’s data sculpture. One group used nests and small spheres to demonstrate population size while another group used stacked, colored balls to indicate high, medium, and low priority populations. Through the creative process of ideating and refining their sculptures, groups found themselves struggling to balance the many considerations of providing adequate aid in the face of a natural disaster, particularly how to balance the number of people and period of times of displacement. Color, size, and proportionality, though used in different ways, united the groups in how to demonstrate both need and supply. One of the workshop participants even took to Twitter, stating, “Creating solutions to help people affected by #CycloneIdai is not easy work, but through data sculptures the relief worker strategy becomes more intentional and less ‘maybe-maybe’.”

Fast, Reliable Information for Humanitarian Crisis Response
Due to Visualst’s work, participants of the first Cyclone Idai Data Stories were able to simulate the magnitude of impact that mobile-phone-based survey research can have on humanitarian aid response in the wake of a natural disaster. Participants were informed of what problems were afflicting people in different areas of Mozambique post-cyclone and how many people in the respective areas needed resources, which gave a voice to those struggling. The information provided by data also gave the participants the opportunity to utilize location and resource information to strategize humanitarian assistance methods and distribution channels, which is essential for efficient resource management and distribution during crisis response.
At GeoPoll, we think that Visualst’s Cyclone Idai Data Stories workshop series is an incredibly creative way to encourage immersive interaction with data. It is hard to emphasize enough how important and worthwhile data analysis is, yet the first Cyclone Idai Data Stories workshop illustrates data’s importance with ease. Although the project focused on data visualization, the participants were able to interact with data in a non-intimidating way. This aspect of the workshop is important especially for people in professions where data analysis is not their expertise. The interactive and creative nature of the workshop allowed participants to focus on what they could do with the information that data provides them and truly find the value in it, rather than getting overwhelmed by rows and columns of seemingly arbitrary strings of numerals, which aligns closely to Visualst’s mission of creating connections between people and compelling data for the purpose of informed decision making.
Mobile-phone-based survey research has many benefits, but the speed, accuracy, and capabilities provided by mobile research can be invaluable to the humanitarian aid response. GeoPoll is a leader in conducting research in hard-to-reach areas around the world, with a specialty in African countries. To learn more about GeoPoll’s capabilities to help gather on-the-ground information in the wake of a natural disaster, contact us today.