Case Study: Misinformation in Indonesia
GeoPoll and the University of Notre Dame conducted a CATI study to examine misinformation in Indonesia
Introduction
Indonesia is a relatively young and unconsolidated democracy, having overthrown dictator General Suharto’s regime in 1998 after three decades of authoritarian rule and holding its first presidential election in 2004. Current President Joko Widodo was first elected in 2014 and again in 2019, having focused on developing the country’s maritime resources and addressing its significant infrastructure needs. Although it is widely regarded as one of the region’s emerging economic success stories, Indonesia continues to grow and develop while facing unique challenges because of this growth.
Indonesia is a highly diverse nation comprised of thousands of islands where over 700 languages are spoken. Heightened tensions between pluralistic, secular democratic policies and Islamic populism have characterized elections in recent years due to the rising influence of conservative religious groups. The central government also faces the threat of secession movements in multiple provinces as well as the presence of several militant groups including the Islamic State. The world’s third largest democracy is in a particularly fragile state as recently proposed amendments to the constitution would cancel direct elections for the president and highly influential regional executives as well as extending term limits.
Indonesia is a highly connected country with roughly 171 million internet users and is becoming increasingly mobile with the world’s 4th largest number of mobile cellular subscriptions. The market for online and mobile media is rapidly catching up to television, which has traditionally been the leading medium for media consumption. Indonesia also boasts a high penetration of social media platforms with 130 million Facebook users, the world’s 3rd largest audience, and over 11 million Twitter users, the 9th largest in the world as of April 2020.
However, factors complicating the free flow of information include the country’s anti-blasphemy laws which have been widely condemned by human rights groups and accused of fostering religious intolerance. In one recent instance, said laws were used to jail the former governor of Jakarta, Basuki Tjahaja Purnama, midway through a campaign after video of a speech that was doctored to make it appear that he insulted the Qur’an went viral and sparked a series of religious protests.
Strategies to influence voters through social media have already been deployed in Indonesia as early as 2014. A noted increase was observed in the lead up to the 2019 presidential elections, causing President Widodo to form the National Cyber and Encryption Agency to assist the country’s intelligence and law enforcement apparatus in combating online misinformation. The creation and spread of fake news is currently illegal, however fake social media accounts that do not impersonate real people are allowed. Reports showed paid influencers known as “buzzers” being directed to disseminate propaganda in favor of both Widodo and his competitor Subianto as part of sophisticated, coordinated efforts during the campaign. The government’s involvement with pushing propaganda or filtering information has also continued outside of the 2019 election. For example, a well-funded effort to quell unrest associated with West Papua’s separatist movement employed the use of bots on several social media platforms to push pro-government messages towards the end of 2019.
As part of the USAID-funded project Advancing Media Literacy Among New Digital Arrivals In Developing Countries, GeoPoll implemented both a baseline and end line survey in Indonesian order to evaluate the Indonesian adult population’s access to traditional media and social media, as well as their exposure to misinformation and fake news. In direct coordination with the University of Notre Dame, GeoPoll designed a comprehensive survey instrument to be used in both surveys. From March 27 – April 24, 2019, GeoPoll’s team of interviewers in Jakarta, Indonesia, implemented a computer-assisted telephone interview (CATI) for 1,000 successful interviews to construct a baseline. The following year, GeoPoll implemented the end line survey from February 25 – March 21, 2020, with the same group of interviewers for 1,000 successful interviews via CATI. The surveys were nationally representative proportionate to 2019 census data estimates at the first administrative level (province), age group, and gender. The main interview language of the survey was Indonesian, but the interviewer team was able to switch to other languages such as Balinese and Javanese if requested by the respondent.
Methodology
Computer-assisted telephone interview (CATI) surveys are administered through call center interviewers. GeoPoll utilized its enumeration platform to facilitate interviewer flow and data collection on any smartphone or tablet that an interviewer utilizes to conduct an interview. Before data collection commenced for both surveys in Indonesia, the team members in Jakarta were trained on standard CATI best-practices such as research ethics, operator refusal aversion, questionnaire design and aim, practice interviews as well as conducting a short pre-test of the survey.
In order to design a probability sampling frame, previous information on the target population was needed to develop a sampling frame. Given Indonesia’s mobile penetration as well as the high number of social media users, GeoPoll utilized a proportionate framework with interlocking quotas at the first administrative level, age group, and gender from 2019 census estimates to develop proportions.
For increased randomization, GeoPoll employed a sampling strategy that it has developed specifically for the CATI mode. For CATI, generally two sampling approaches are utilized – a targeted approach that uses a finite number of phone numbers from a known database or random digit dialing. For the baseline survey, GeoPoll’s utilized a verified random digit dialing (RDD) sampling approach of mobile phone numbers within each country. The same verified RDD approach was used for the end line survey, but GeoPoll also introduced sampling gathered from visitors to LiterasiMediaSocial.id who had consented to providing their phone number to participate in the survey. This subset of the sample engaged in the website’s content related to media literacy education.
The process of sample generation for verified RDD involves key three central steps. First, GeoPoll collects all the information to formulate a list of the Mobile Station International Subscriber Directory Numbers (MSISDNs) in Indonesia. GeoPoll ensures that each list includes the country code any mobile network operator specific prefixes. Although most countries allow number portability, many mobile network operator prefixes are fixed within Indonesia
Second, different countries have varied digit lengths that depend on the specifics of said country. In Indonesia this ranges between 10 to 14 digits for the full MSISDN. GeoPoll uses systematic number generation syntax to back fill the remaining digits to complete the full length of the phone digit. The process code is returned such that it removes duplicates and ensures complete randomness when sample is generated. With this generation, GeoPoll can produce a large randomized list of MSISDNs in a country.
Lastly, GeoPoll utilizes its platform to validate which mobile phone numbers in the randomly derived sample are real mobile subscribers. GeoPoll is able to query this database to obtain information about the RDD generated numbers such as the mobile network operator, and if the number is currently attributed to a live mobile subscriber. With this information, GeoPoll extracts all the live subscribers in the sample for the overall sample to utilize in the sampling approach of verified RDD. To add additional randomness, GeoPoll utilizes a simple random selection approach daily for calling. All numbers in the sample frame that are unresponsive or disconnected are moved to the next day of calling in addition to new sample being introduced. All phone numbers that are unresponsive or disconnected are called a minimum of three times over several days before being excluded from the daily sample. This cyclical sample approach ensures that phone numbers that are not answered or disconnected are given a chance for participation in the survey.
During data collection for both the baseline and end line, the enumeration team made approximately 16,000 phone calls that resulted in a 21 percent response rate. The margin of error in survey research defines the amount of the random variation underlying a survey’s results. This can be thought of as a measure of the variation one would see in reported percentages if the same survey were taken multiple times by the population of interest. The larger the margin of error, the less confidence one has with the survey results. The margin of error for both survey projects at a 95 percent confidence level is +/- 3.10 percent.
Demographics
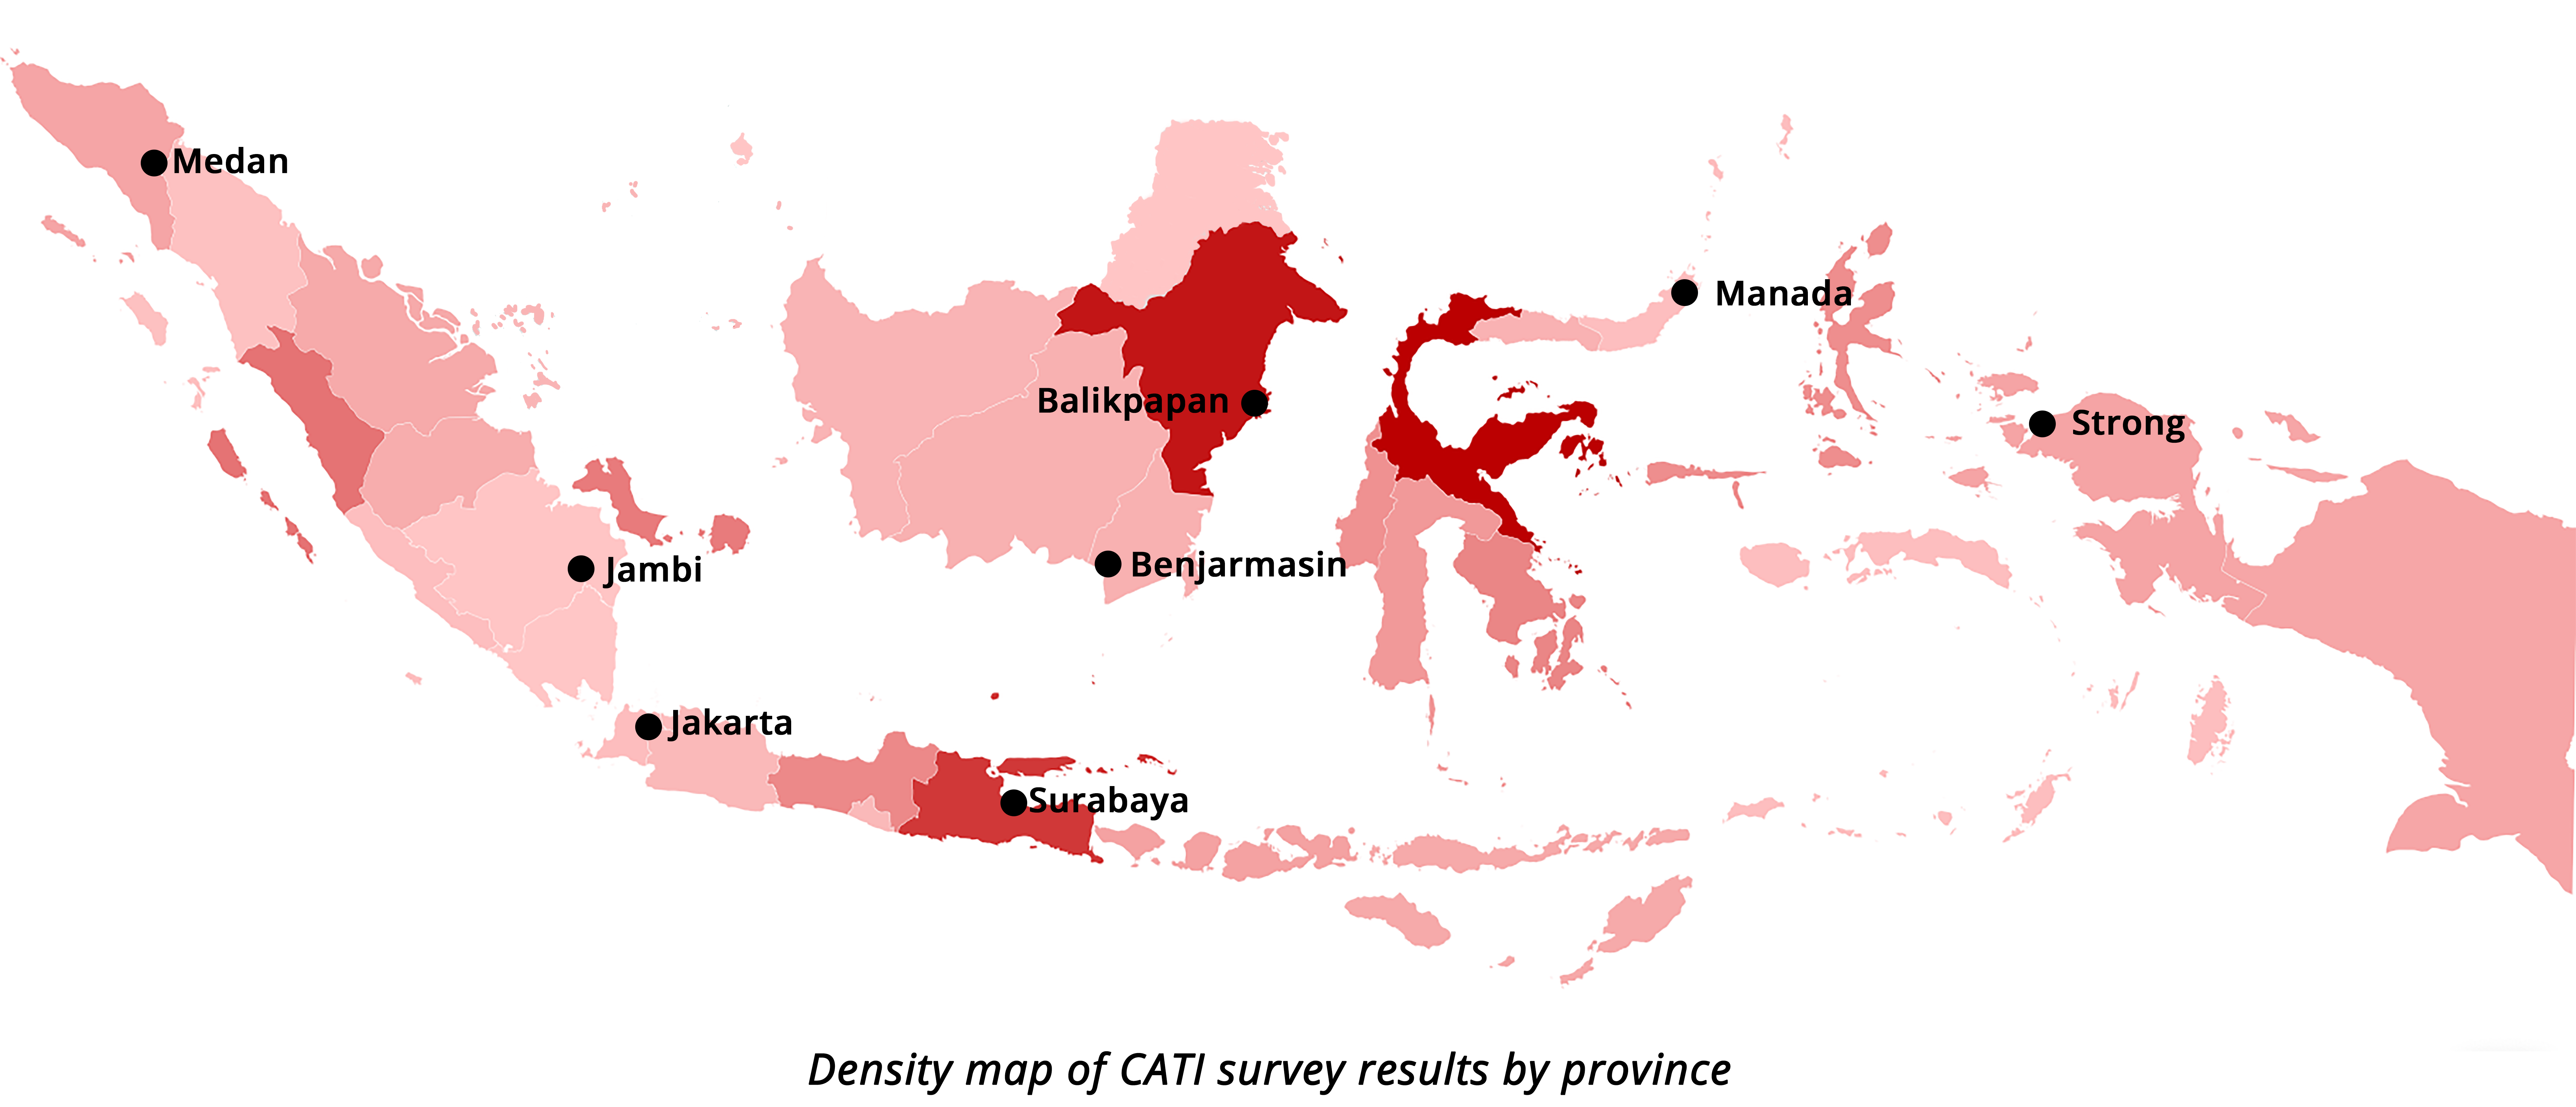
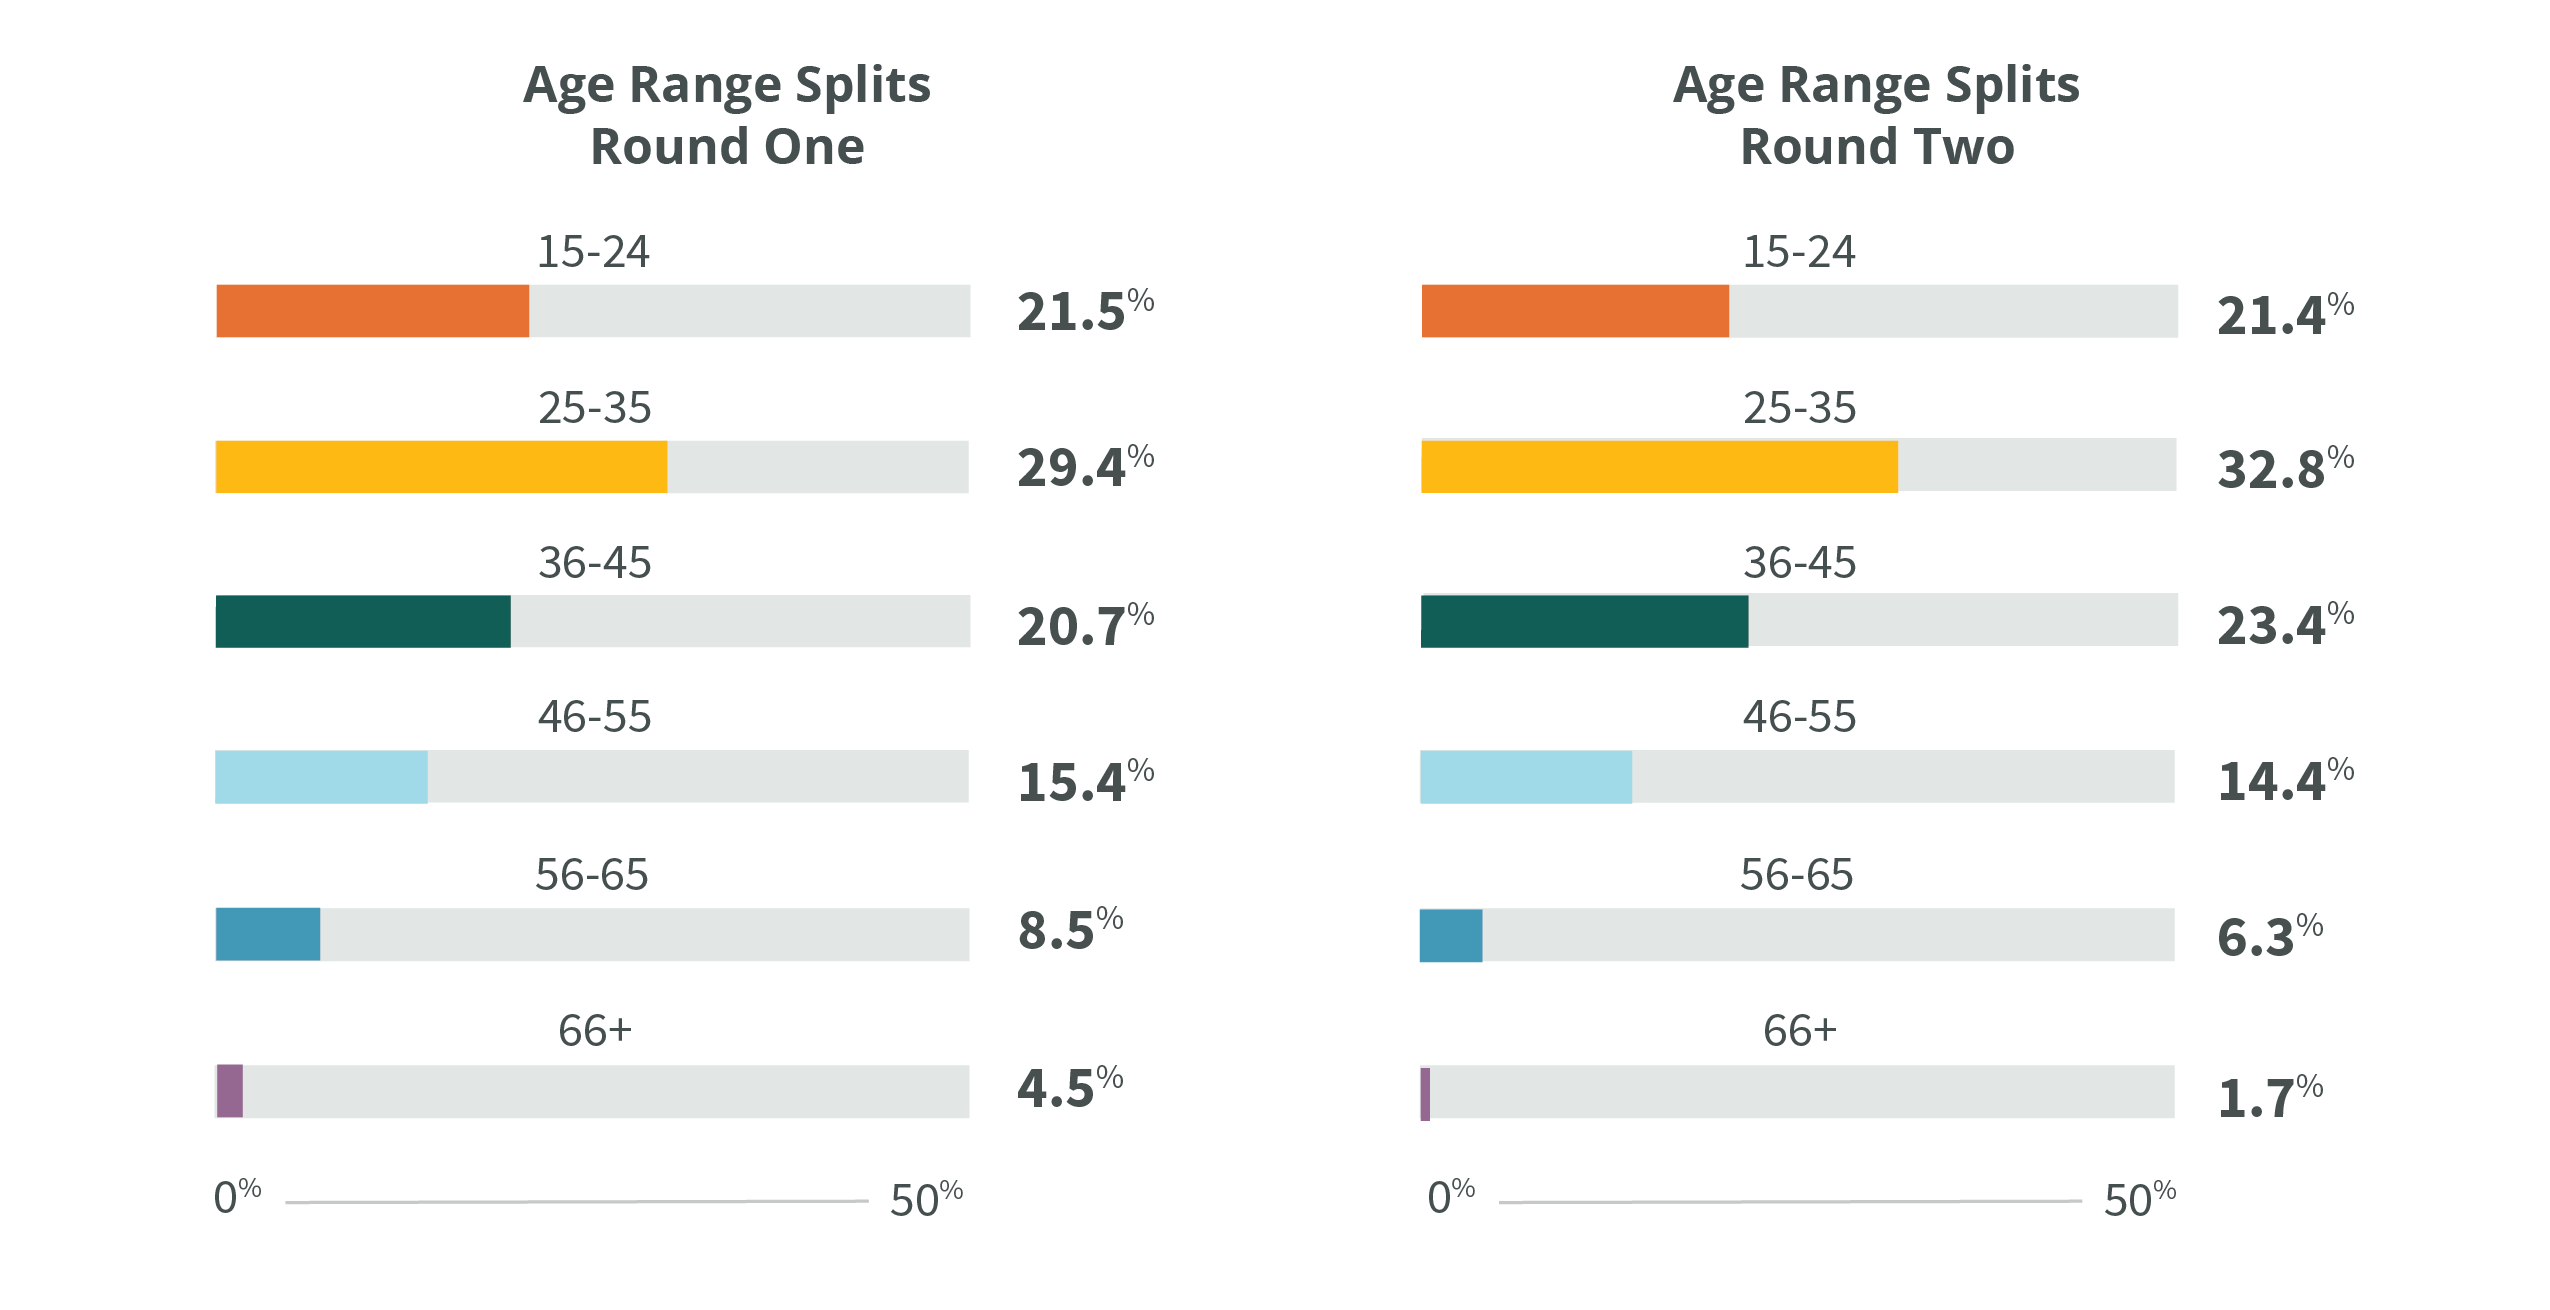
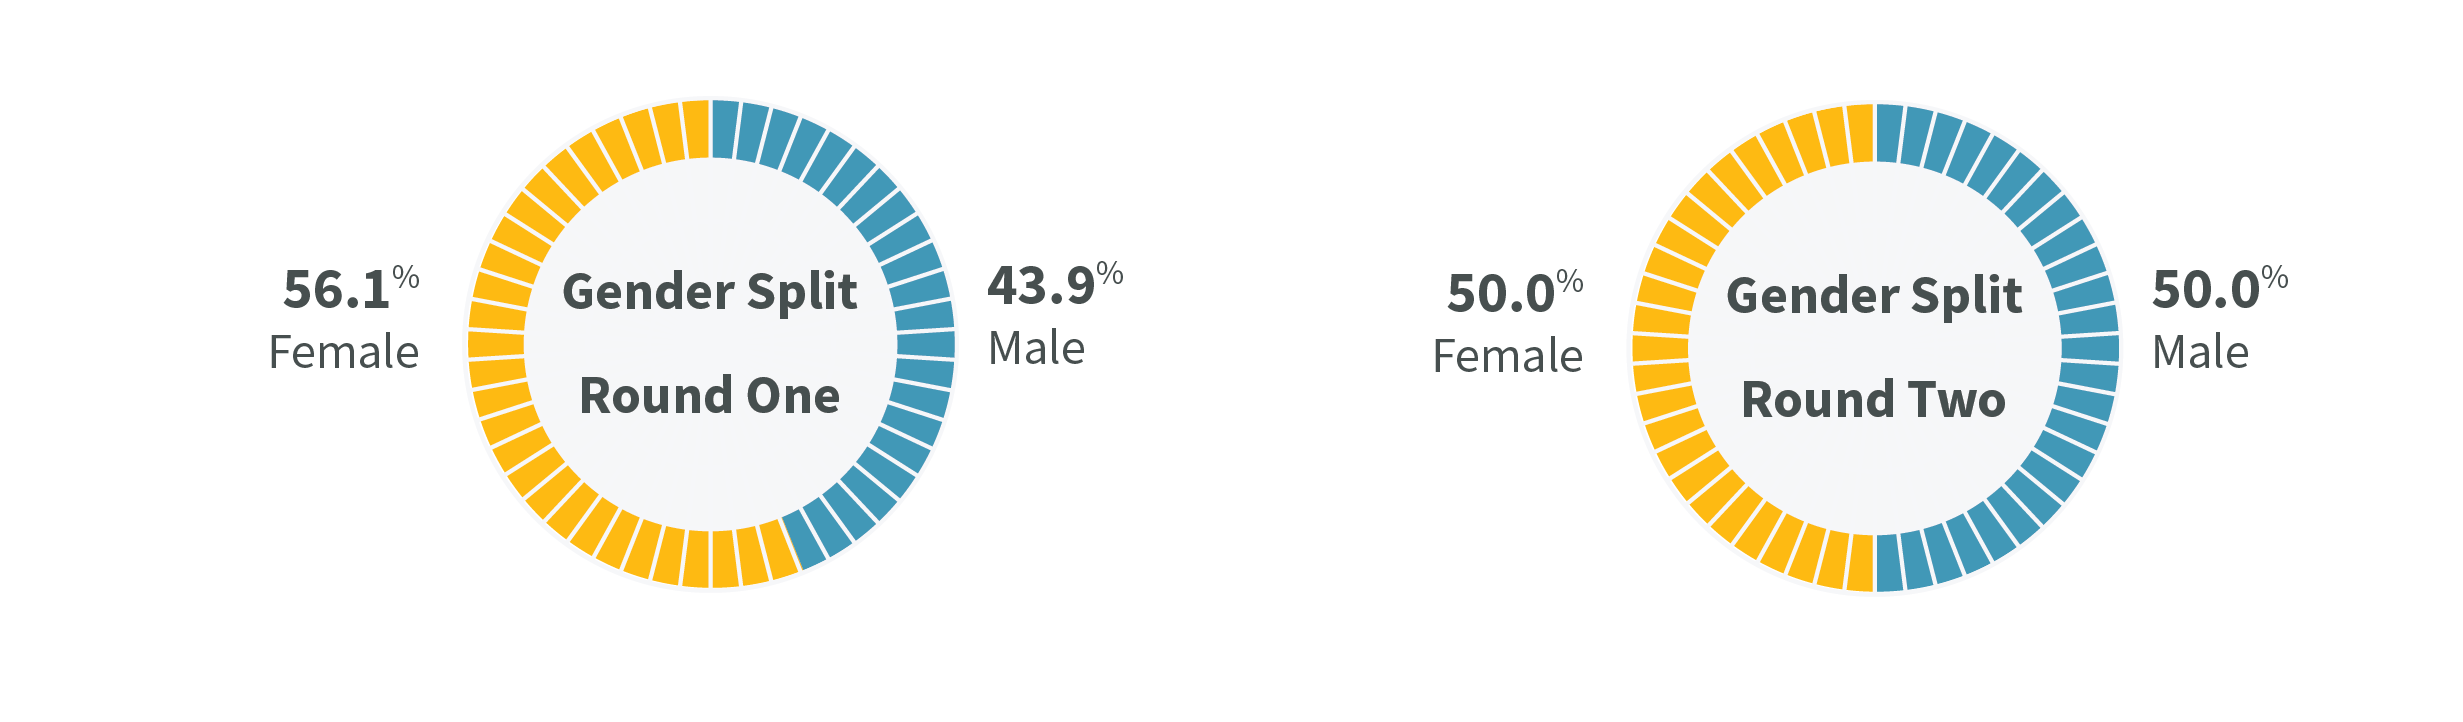 All 34 provinces in Indonesia were represented proportionately to Indonesia’s population in the 1,000 completed surveys. Although the age and gender quotas are proportional within each province, overall 43.9 percent of the respondents that completed the survey in the first round were women and 56.1 percent were men. The second round of the survey saw a perfect 50/50 split in gender. For age groups in the first wave of the study; 21.5 percent of the respondents were between the ages of 15-24, 29.4 percent between the ages of 25-35, 20.7 percent between the ages of 36-45, while 15.4 percent were between the age of 46-55. For the older subset of the population, 8.5 percent of those that completed the survey were between the ages of 56-65 and 4.5 percent were 66 or older. The second wave in 2020 saw only minor differences in age breakdown, with 21.4 percent of the respondents between the ages of 15-24, 32.8 percent between 25-35, 23.4 percent between 36-45, 14.4 percent between 46-55, 6.3 percent between 56-65, and 1.7 percent over 65 years old.
 Other demographics were collected despite not being part of the sampling framework, including education levels, religious affiliation, and whether the respondent lives in an urban or rural area. For educations levels, one percent of the respondents in both the first and second rounds replied they have never attended school, and approximately two percent of respondents in both rounds indicated that they did not complete primary education. One percent of respondents in the first round reported completing Quranic education, though only a single respondent selected that option in the second round. In the second round, 11.8 percent completed primary school (down from 15 percent in the first round), and a majority of the respondents at 60 percent (up from 59) had completed secondary education. Some form of higher education, either college or university, was reported by 24 percent of the respondents (up from 22 percent in the first round). The vast majority self-reported Islam as their religion in the first round with 86 percent of all respondents (91 percent in the 2nd), while 12 percent indicated they were Christian (falling to 6 percent in the 2nd), and two percent had another religious affiliation (1 percent in the 2nd round). Lastly, a slight majority of 57 percent of the respondents noted they lived in a rural area (up from 54 in the 1st round), and 42 percent identified the area they lived in as urban (down from 45 in the 1st round).
Media Consumption – Indonesia
To evaluate the type of media in terms of platform and broad topics, the survey measured access to various media entities as well as determining which type of content an individual regularly views and follows.
Only 20 percent of those that completed the survey in the 2nd round, falling from 25.3 percent in the 1st round, indicated that they “Often” or “Almost always” follow national political affairs and events, while the remaining respondents indicated sometimes, seldom or never. In terms of international news, 78 percent of the respondents indicated they sometimes, seldom or never follow international events and affairs (down from 85 percent in the 1st round). Male respondents were more likely to follow international events and affairs compared to female respondents, as 16.4 percent of males surveyed selected “Often” or “Almost always” compared to 8.7 percent of female respondents (both groups falling slightly to 12 percent and 8 percent in the 2nd round). Local news was more impactful as approximately 41 percent of those surveyed (42 percent in the 2nd round) indicated they almost always or often follow local events and affairs.
The purpose of this study was to measure how misinformation and fake news stories are spread, therefore respondents who were social media users were given extra focus. In first of the two rounds of the survey, 75.9 percent of the respondents used social media, of which 93.6 percent reported they access social media on a daily or weekly basis. These portions saw some variation in the second round as 82 percent of the total respondents reported using social media, though only 78 percent indicated that they used it daily or weekly. From the subset of respondents that used social media, other information media such as television were viewed daily by 72 percent (70 percent in the 2nd round), while 54 percent (62 percent in the 2nd round) replied they did not listen to radio at all. Print media such as a physical newspaper or magazine was generally less popular, with over half of respondents in both rounds either never having read a newspaper or magazine or doing so less often than once in a month.
For the subset that reported using social media, when asked what the primary source of news was, television led as the main medium for news with a plurality of respondents, with approximately 35 percent in the first round and 29 percent in the second. Facebook was the second most reported platform for news with 14 percent (16 percent in the 2nd round). The remaining respondents in the subset indicated an array of media such as other social media platforms, the Internet, and traditional news platforms such as magazines, newspapers, and radio. Overall, the portion of respondents selecting social media platforms as their primary source of news increased from 38 percent to 43 percent in the following year.
Indonesian Social Media Use
Respondents that had earlier in the survey indicated that they use social media outlets were asked a series of questions to determine what popular platforms they have an account on and where they get news from. The popular platforms asked about in the survey are Facebook, YouTube, Twitter and WhatsApp. Other social media platforms were captured in the survey through an open-ended style question.
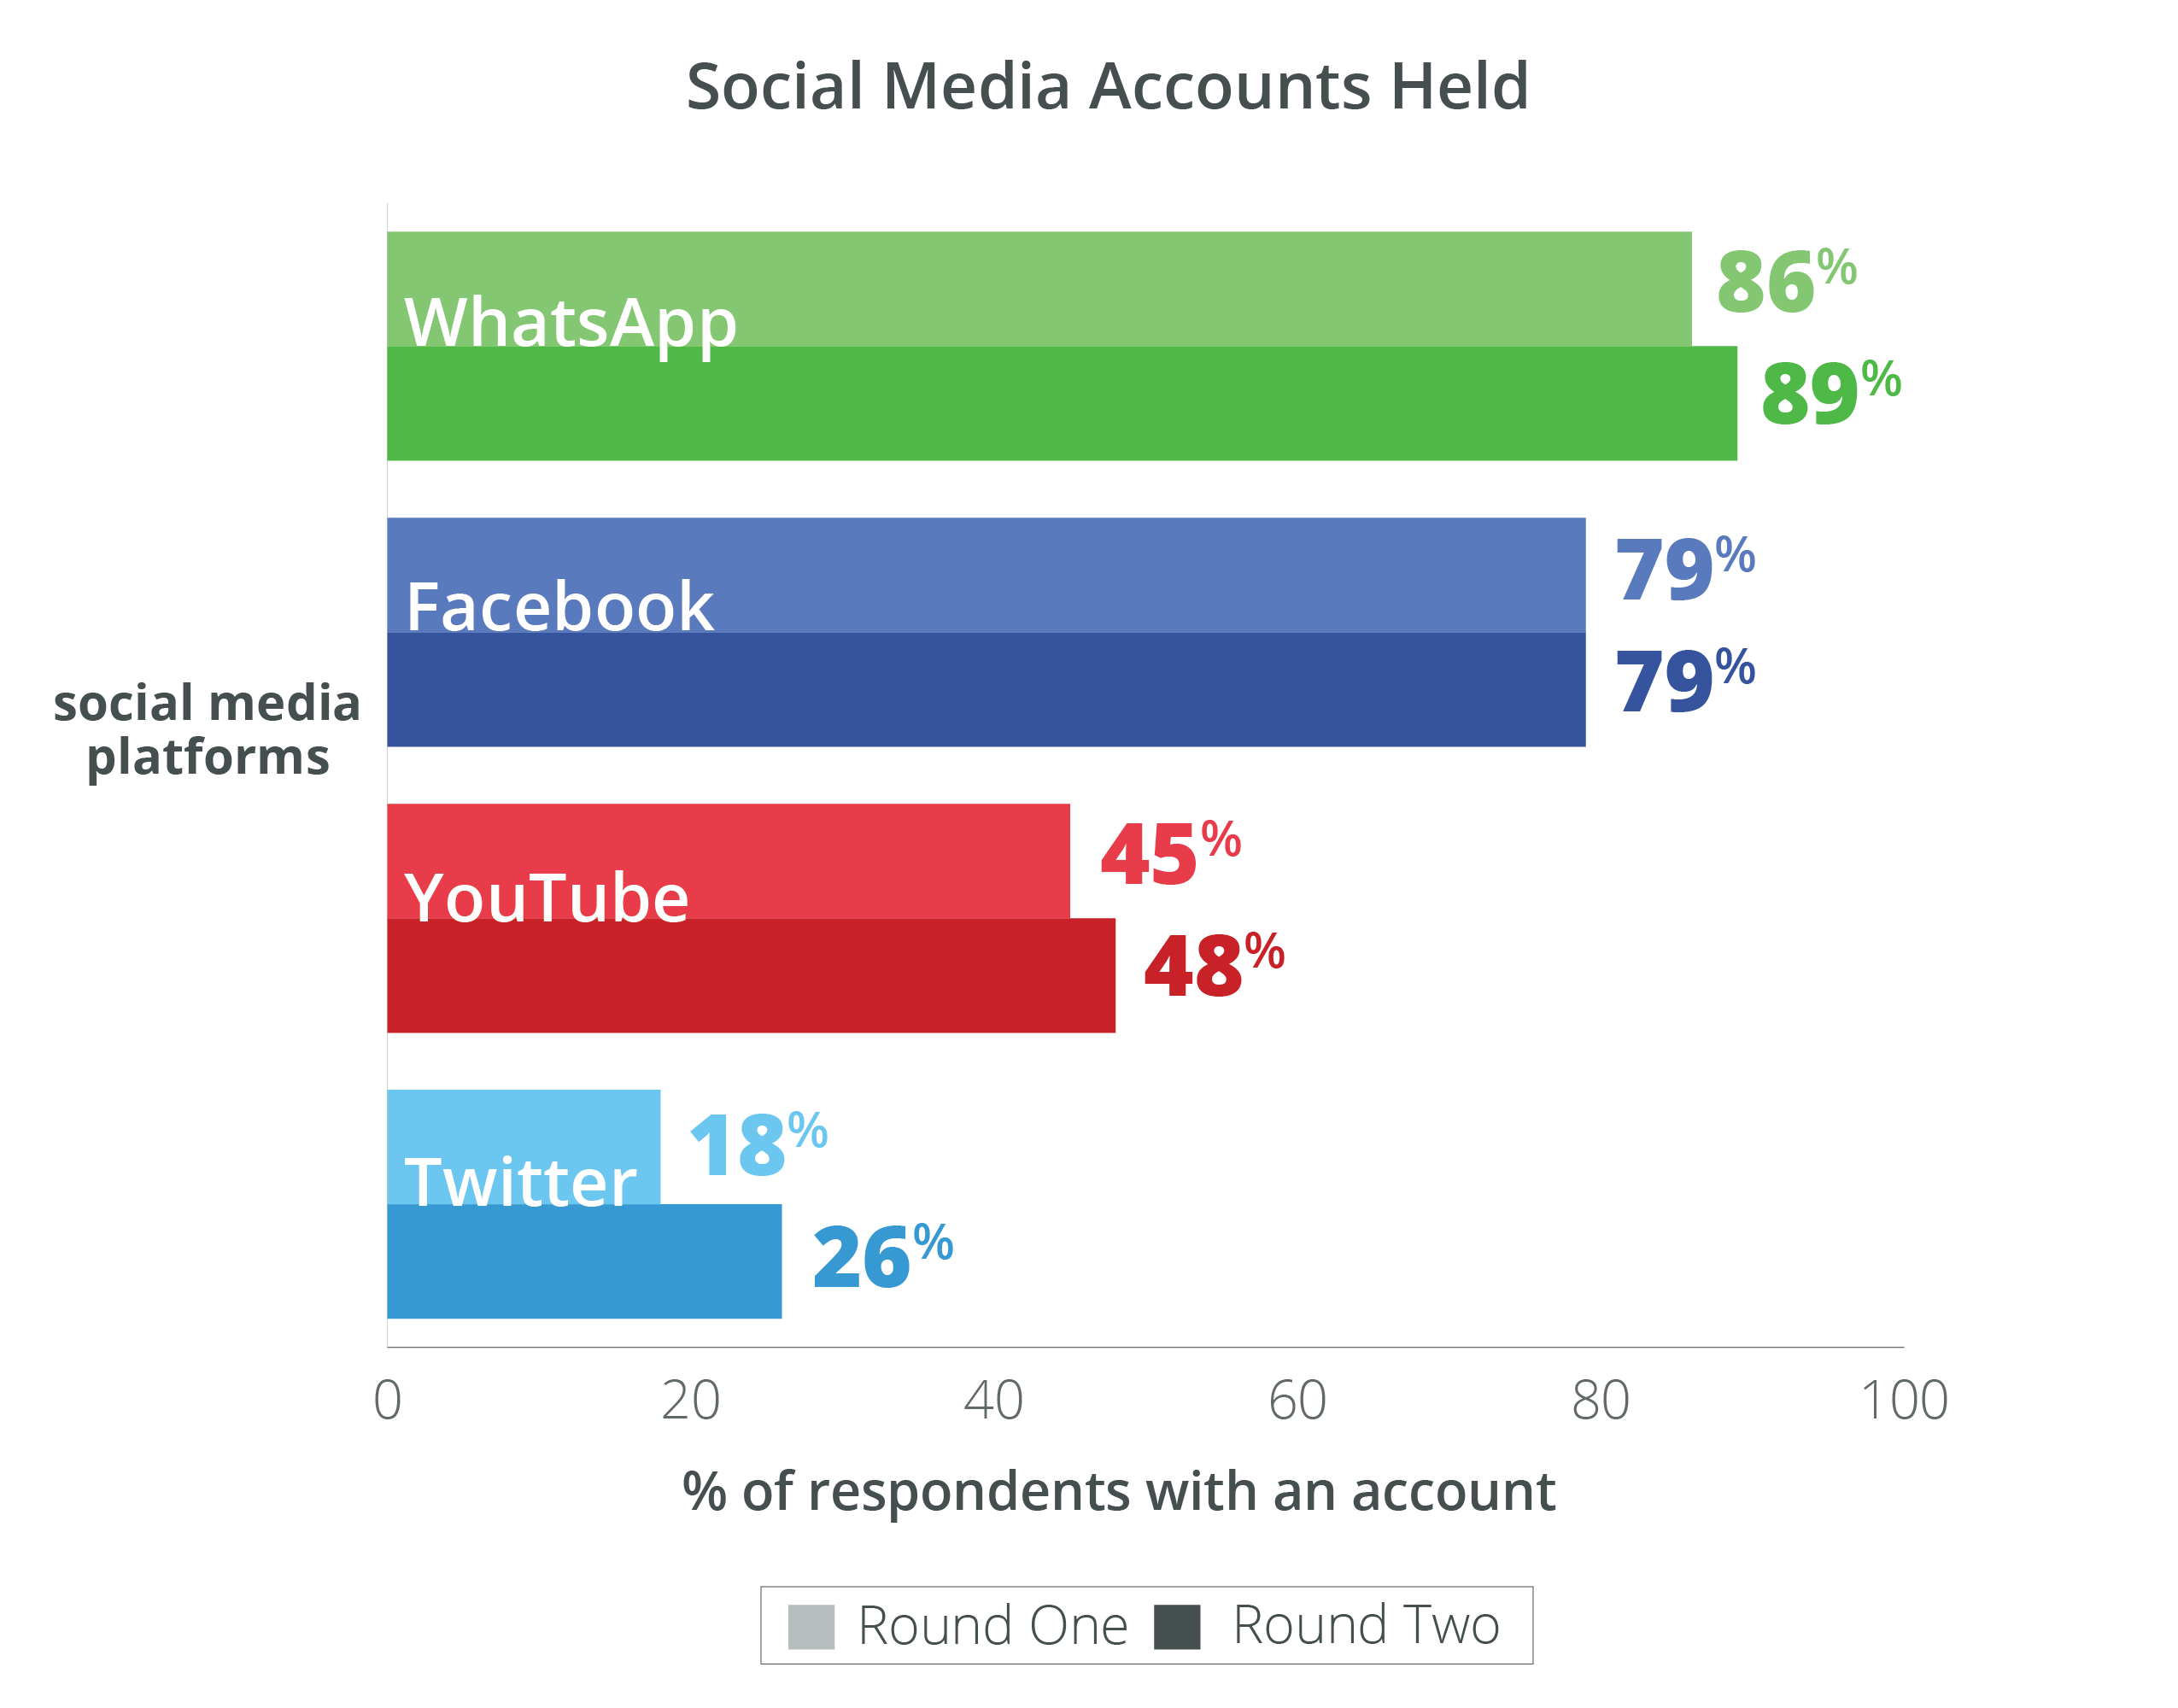
Respondents that use social media were more likely to have a WhatsApp account (86 percent in 2019, 89 percent in 2020) compared to all other social media platforms. Facebook came in second for the subset that use social media, as 79 percent of the respondents reported having a Facebook account in both waves of the survey. Only 18 percent of those that use social media and that were surveyed in the first part of the study indicated they have a Twitter account, increasing to 26 percent in the second wave. For YouTube, 45 percent of the subset that use social media originally replied they have an account on the popular video platform, rising to 48 percent in 2020. Approximately 16 percent of the subset that uses social media initially said they have an account on other platforms, though this portion more than doubled to 35 percent in the final survey. Instagram was by far the most popular subset, seeing an increase from 67 percent to 90 percent. Though Facebook was used equally by both genders, female respondents polled in the second wave indicated that they were more likely than the male respondents to use WhatsApp, YouTube, and Instagram in particular.
For the subset of respondents that use social media, 42 percent replied that they use Facebook regularly to read and watch local news and events, down from 54 percent the year before. Approximately 32 percent (down from 38) indicated that they use YouTube to read and watch local news and events. Male respondents had a slightly higher propensity to use both Facebook and YouTube for this purpose compared to female respondents. One quarter of the subset (down from 32) that uses social media selected WhatsApp for the purpose of local news and events, and only 12 percent (up from 8 percent) selected Twitter. The final wave of the study saw a decrease in social media-using respondents selecting “Other” from 17 percent to 10, with a slight increase from 4 to 6 percent indicating that they did not regularly use a social media platform.
For global news and events, YouTube led among the subset that uses social media, though YouTube saw its usage fall from 43 percent to 38, losing both male (45 percent to 40 percent) and female respondents (41 percent to 36 percent). Facebook was the second most selected platform despite an even larger drop down to 26 percent from the previous year’s 36 percent. Interestingly, the portion of respondents selecting “other” almost doubled, standing at 18 percent after the final wave.
Overall, assessing social media account use and determining how local and global news is read and watched provided insights into how information is spread. For example, a consistently large majority of those that use social media across both waves responded that they have a WhatsApp account, though less than one-third uses the platform to read and watch local news and events. This suggests that news content is not as widely disseminated on WhatsApp compared to other social media platforms. Perhaps not surprisingly, social media platforms that are known to monetize advertisements and targeted content such as Facebook and YouTube are the leading platforms for those surveyed to read and watch both local and global news and events.
Misinformation & False News
Respondents who indicated that they use social media were asked how often they read news stories before sharing them with others. In both rounds, a plurality of more than a quarter noted that they sometimes read the full news story before sharing, however, 42 percent of the subset (rising to 44 percent in the 2nd round) indicated that they rarely or never read the news story before sharing. When asked what part of the post would the respondent typically read before sharing or “liking”, 19 percent said they read just the headline, down from 25 percent in the 1st round. Only 46 percent of the subset admitted to reading the entire article before liking or sharing the news item on social media, up from 40 percent the previous year.
One of the more compelling data points of the survey examined if respondents intentionally share news stories that they know to be false with others. When asked directly, 4 percent of the survey participants that use social media reported in the first round that they shared false stories to others (3 percent in the 2nd). Over half of the respondents in this subset (56 percent in the 1st year, 52 percent in the 2nd) reported that they shared false stories to enlighten others on false news. The portion of those sharing false stories for fun fell from 16 percent to 4 percent. There were some differences by gender, with males more likely to select “Frightened of being exposed to the law” and females much more likely to select “To make people know what’s trending”. It is important to note that this group of respondents admitting to sharing false news stories accounted for a very small subset of the survey with only 25 total respondents.
Accessing Real, Misleading & Misinformation
In addition, a randomized module was developed for the survey in order to measure how well a representative sample of people in Indonesia can assess the validity of news stories that they encounter. In coordination with Cekfakta, University of Notre Dame team members provided GeoPoll with a series of news story headlines that were classified as real, misleading and misinformation. Five real news headlines – from news stories that are widely regarded as accurate and truthful information as judged by reputable media sources – that would be well-known in Indonesia were selected. Additionally, five news headlines were provided which were classified as misleading, as a part of the story was inaccurate but had a portion that was truthful.
Lastly, four news story headlines that were classified as misinformation, or fake news, were provided. These news stories contained false information and unsubstantiated events and occurrences. All news story headlines in each category were selected for the module because they had already been widely shared through social media in Indonesia.
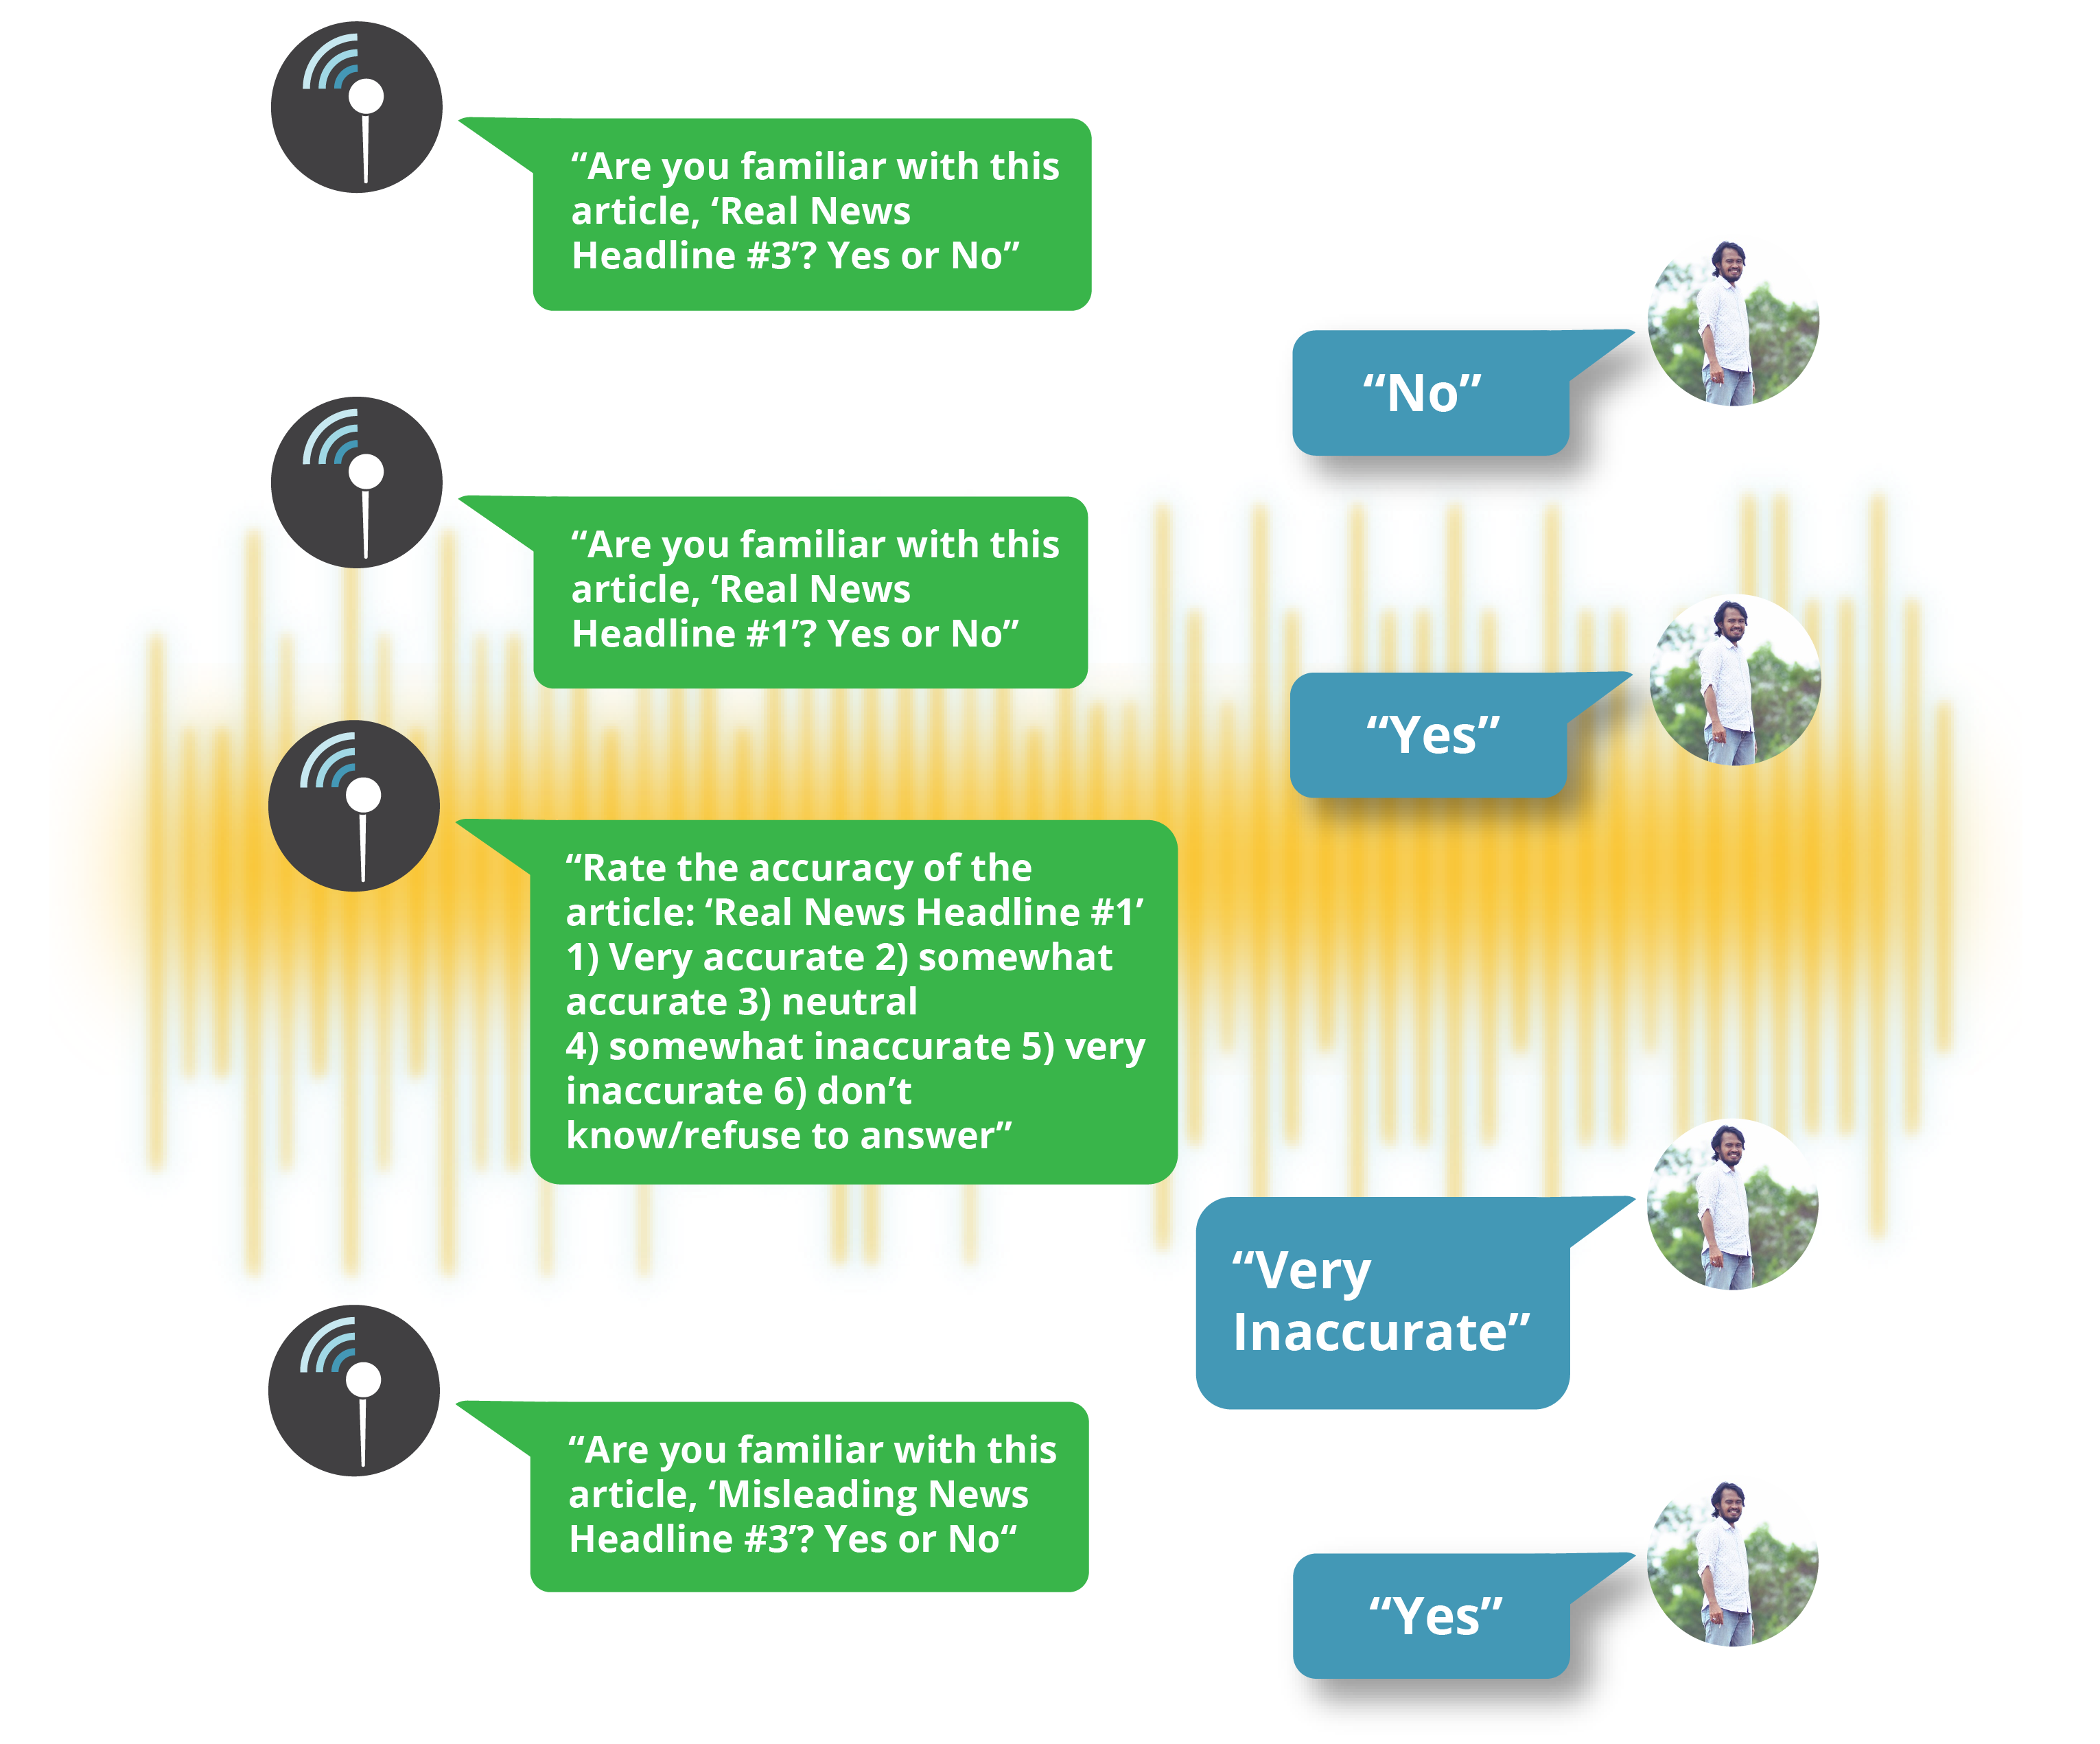
The randomization module developed within the survey instrument prompted each respondent to evaluate two real, one misleading, and one misinformation news headline, each picked randomly from the respective pools of stories curated by Cekfakta and the University of Notre Dame. Respondents were given the descriptive headline first, then asked if they had heard of the news story. Respondents who answered that they had heard of the story were then asked to rank its accuracy using one of six options: Very accurate, Somewhat accurate, Neutral, Somewhat inaccurate, Very inaccurate, or Don’t know / Refused.
In the first round of the survey, assess each of the two stories’ accuracy. Interestingly, 40 percent of the subset believed the real news stories were “Neutral”, while 24 percent said the stories were somewhat inaccurate or very inaccurate. The remaining 7 percent of the subset either did not know or refused to answer the question. The second wave of the survey saw relatively few changes in the following year, with a slight (4 percent) increase in those identifying the real article as “Very accurate”, and a decrease in respondents identifying the headline as “Very inaccurate” of 7 percent.
 For the part of the module that presented a misleading news headline randomly, only 24 percent of those that completed the first round of the survey had heard of the one story they were asked about. Out of this subset, 24 percent believed the misleading story was “Very accurate” or “Somewhat accurate”, while 46 percent reported that the story was “Neutral”. A quarter of the subset (25 percent) believed the misleading news story was “Somewhat inaccurate” or “Very inaccurate”. The remaining 5 percent of the subset either did not know or refused to answer the question. Results from the second wave also show only a slight change with 7 percent fewer respondents answering “Neutral” and a 4 percent increase each for “Very inaccurate” and “Don’t know / Refused”.
The misinformation news story headlines were known by approximately 41 percent of the respondents that completed the first round of the survey. Thirty-seven percent of the subset that heard of the news stories in the misinformation portion of the module believe the news story they knew of was “Very accurate” or “Somewhat accurate”, which was the highest out of any of the news story classifications. Approximately 31 percent noted the news story was “Neutral”, while 28 percent said it was somewhat inaccurate or very inaccurate. Only 4 percent of the subset did not know or refused to rank the story’s accuracy. Some promising changes were displayed in the following year’s survey, as the portion of respondents identifying the misinformation headlines as “Very accurate” or “Somewhat accurate” dropped by 10 percent and 7 percent respectively. The same wave saw an 8 percent increase in respondents identifying the false articles as “Somewhat inaccurate” and a 4 percent increase for “Very inaccurate”.
As part of the final wave of the study conducted in 2020, a small group of participants were introduced to the LiterasiMediaSocial.id website and its media literacy materials to form a separate cohort. These 86 Indonesians were measured separately from the larger control group to illustrate any impact that the website had on their ability to correctly assess the validity of news stories. As measured against the baseline data detailed previously, the second wave saw this “trained” cohort performing only slightly better than the control group incorrectly identifying real news stories, with a decrease of 12 percent in those identifying the real headlines as “Somewhat inaccurate” or “Very inaccurate” compared to a decrease of 7 percent the larger group, as well as an increase of 6 percent identifying the headlines as “Somewhat accurate” or “Very accurate” compared to a 4 percent rise.
The ability to correctly identify misleading news headlines did not vary much from the control group. The “trained” group saw an increase of 2 percent in those identifying the misleading headlines as “Somewhat accurate” or “Very accurate” compared to an increase of 1 percent the larger group, and an increase of 5 percent identifying the headlines as “Somewhat inaccurate” or “Very inaccurate” compared to a 2 percent rise.
The “trained” group did however demonstrate a higher capacity for identifying headlines in the misinformation category as “Somewhat inaccurate” or “Very inaccurate” than those in the control group, seeing an increase of 28 percent compared to 12 percent, though very little difference was recorded between the two groups regarding decreases in respondents identifying them as “Somewhat accurate” or “Very accurate” (falling by 16 percent as opposed to 17 percent).
Conclusion
The baseline and end line survey results clearly demonstrate that a sample of 1,000 Indonesians proportionately representative to the overall population by gender, age, and province both is exposed to and spreads misinformation, often unbeknownst to the individual. Nearly 80 percent of the survey respondents in both rounds regularly used social media and about 70 percent of this subset admitted in the first round to sharing a news stories without always reading the full article, though this fell to 54 percent in the second round. Only 3-4 percent of the respondents that completed the survey indicated they intentionally share news stories they know to be false, suggesting that most of the spread of misinformation is inadvertent.
In the module that measured respondents’ knowledge of real, misleading and misinformation news stories, results varied greatly among survey participants. Proportionately, more respondents in both rounds heard of the misinformation news stories compared to the real and misleading stories. More importantly, this subset often believed that the misinformation news stories in the module were more accurate comparatively to the real and misleading stories. Even the respondents that had heard of the real news stories were split on whether or now the stories were accurate, neutral, or inaccurate. These results suggest that media literacy and the ability for Indonesians to accurately evaluate media is lacking among the general population regardless of location, age, gender, education attainment, or religious affiliation. However, the small group that visited LiterasiMediaSocial.id and was exposed to its media literacy materials did appear to have a heightened capacity for identifying misinformation news stories as inaccurate. The sample size was too small to draw empirically sound conclusions, though the results indicate that interaction with the website could result in improvements in media consumers’ ability to recognize fake news, and certainly presents an opportunity for future study.
Authored by Ian McDonnell and Tavian MacKinnon